Predicting the Status of Marijuana Legalization in U.S. States
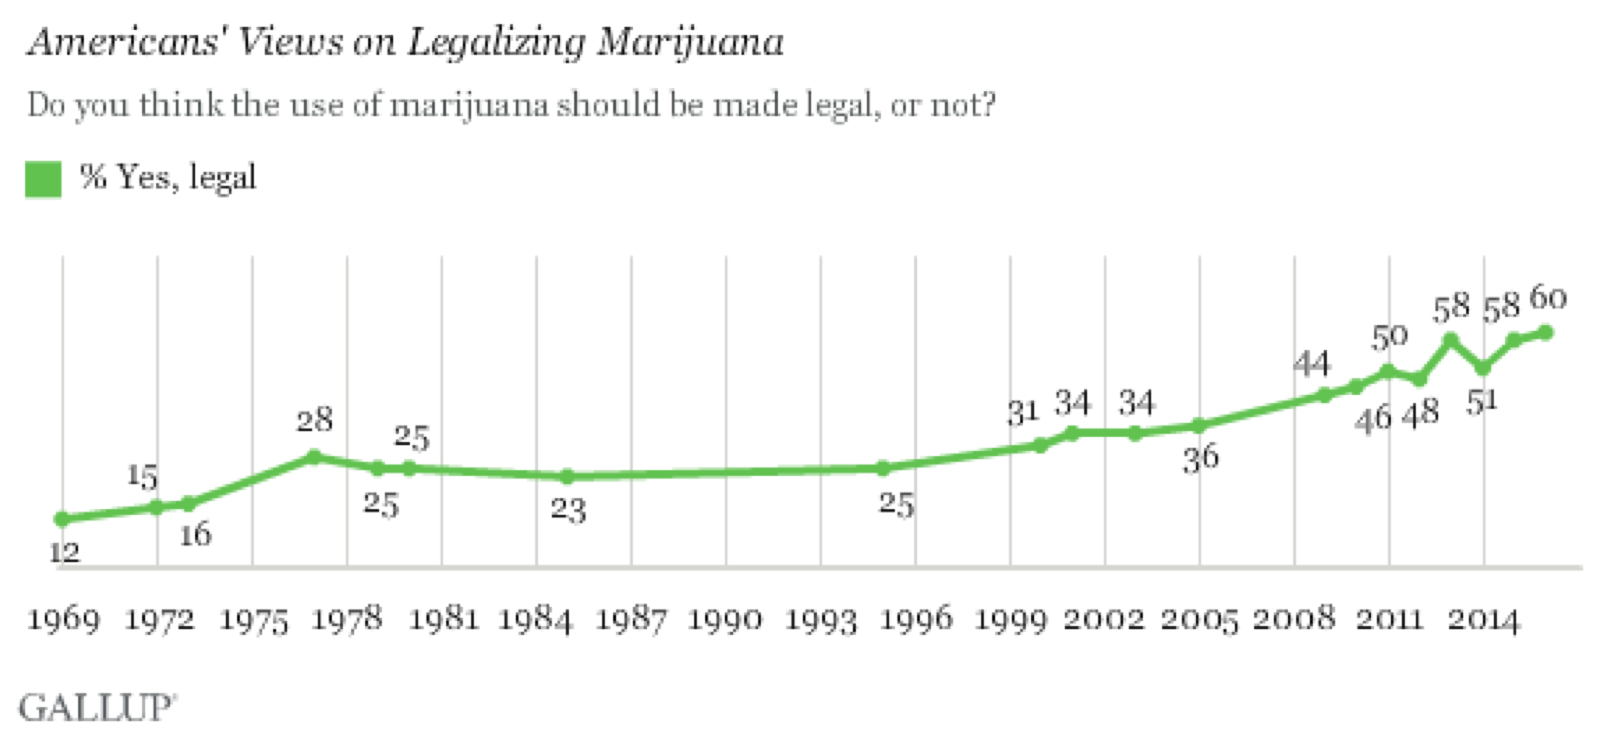
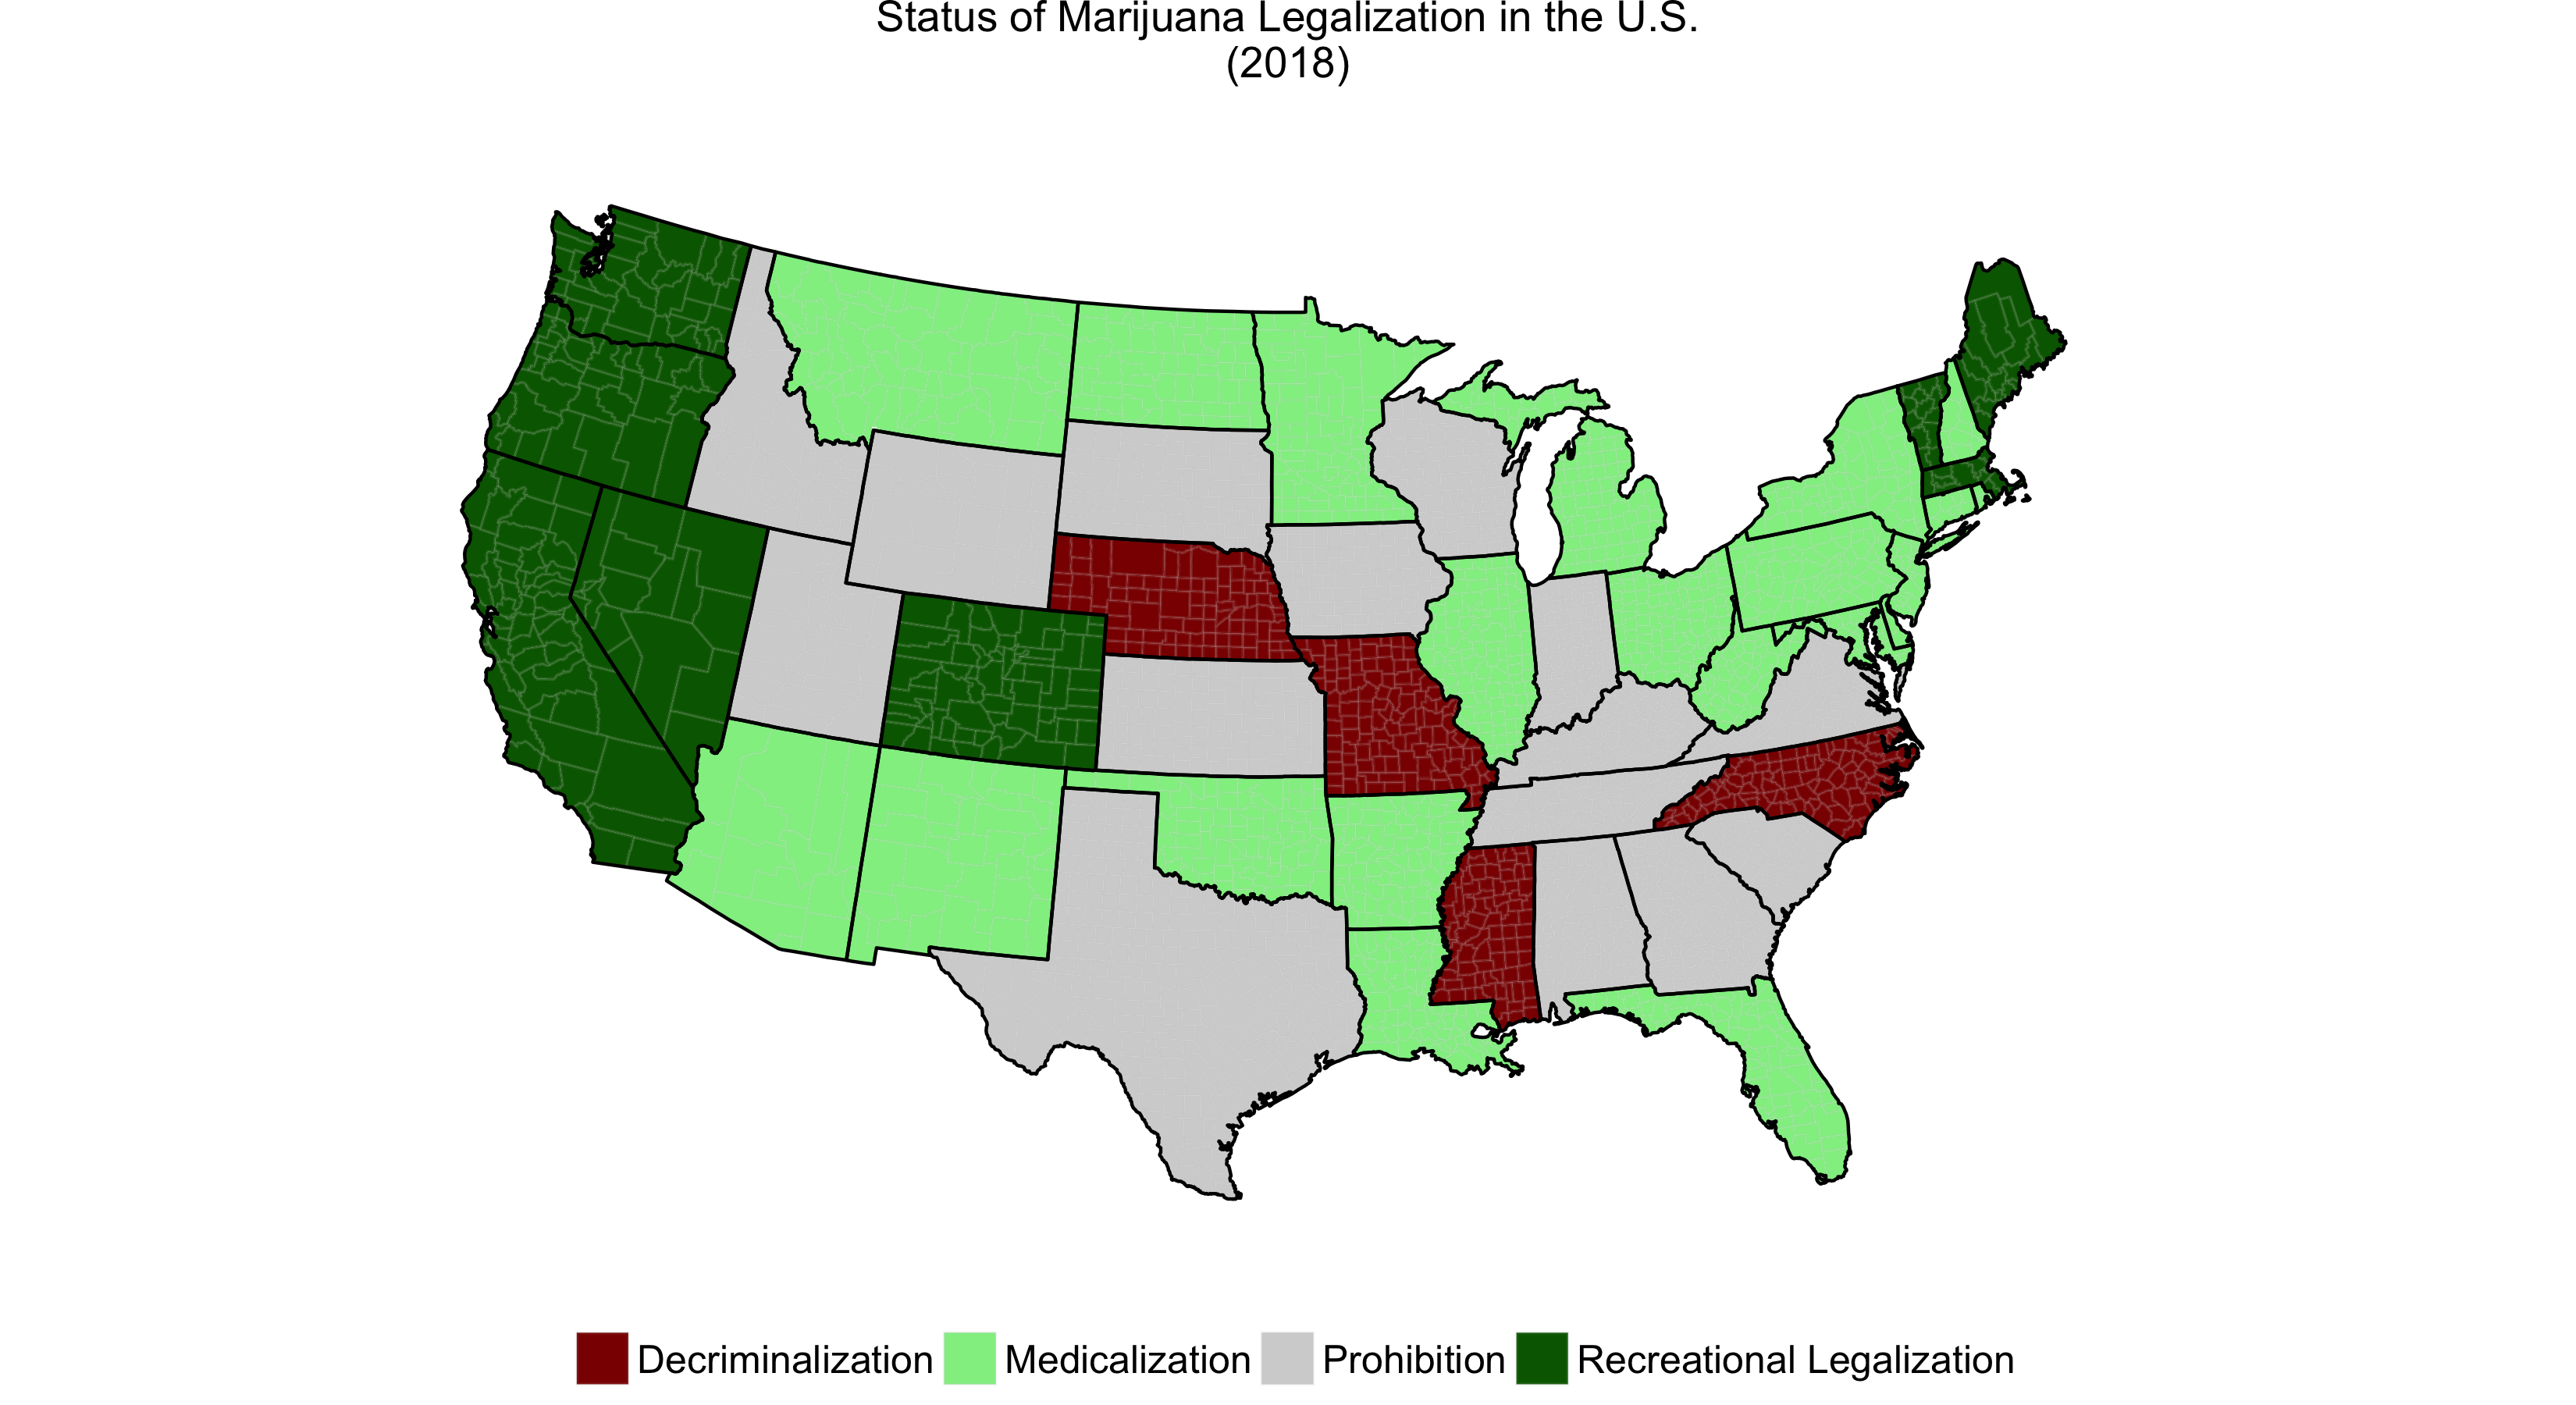
For the past 20 years, marijuana legalization has gotten great deal of attention. In fact, and support for recreational use has risen steadily during that time: as of 2013, a majority of Americans support legalization. However, many states go through various stages before ultimately legalizing: the four stages are: prohibition, decriminalization, medicalization, and legalization.
Currently, it's become of critical importance to understand what leads to legalization and use that knowledge to help us predict the next U.S. state to legalize. We know that machine learning is used for
Machine learning consists of families of algorithms for exploring data and predicting outcomes. In social sciences, because we often want to have more control over the analytical process than relying "solely" on algorithmic findings (e.g. statistical regression techniques), we would side with "supervised" over "unsupervised" algorithms. We use supervised algorithms when we know the outcome value or answer for a subset of our data. Supervised algorithms work by reading in a set of features (independent variables) and the label (dependent variable or outcome) and the algorithm works to figure out a solution from the features to the label. Compared to standard frequentist statistical procedures, the model (e.g. the equation from X values -- the independent variables -- to the y value -- the dependent variable) is not as important as
The Models
Linear Discriminant Analysis
Imagine you plot points on a two-dimensional graph (two features). LDA generates a straight line that separates groups of labels in a way that minimizes errors -- thus misclassifying the least number of cases. Think OLS regression.
Logistic Regression
Using a two-dimensional graph, the logistic regression (logit) uses a transformation of the straight-line (a logit function of the line or probability curve between 0 and 1) to separate groups of labels in a way that minimizes errors -- thus misclassifying the least number of cases.
Support Vector Machines
SVMs attempt to separate out the groups defined by the labels using a line (or a transformation of that line) that maximizes the distance between the dividing line between the groups of labels. SVM has advantages over LDA (OLS-type regressions) in that, when dealing with data that can't easily be separated by a linear function, SVMs employ a "kernel" that converts the dataset into a function of itself, thus making it easier to come up with an equation for a dividing line between the groups of labels.
K Nearest Neighbors
We can think of KNN as a sort-of correlation or network based technique where the algorithm reads in all the features, plots them in n-dimensional space, and identifies the
Decision Tree
Think: flowchart. Creates a dividing line (slices the data, in any way) based on the largest percentage of cases that can be categorized as under one label, then creates another dividing line based on the second largest percentage of cases that can be categorized under one label, and so on, and so forth... Therefore, it is important to note that this method is prone to overfit.
The Exercise
To predict whether or not a state (in the future) will legalize marijuana for recreational use, we need to study the data from the past. Here, I use cross-sectional state-level data (aggregated over time up until 2016). I randomly select 80 percent of the data on which to train the algorithms (the training data set) whereby the algorithms can learn their predictions, and 20 percent as the test set, on which the algorithm can test it's predictions (from the training set) and calculate how accurate it was. I then apply the most accurate algorithm to hypothetical cases. I use the following label and features, based on state-level factors and prior research:
Label:
- Status: State's status of legalization (by 2018):
- 0 = Prohibition; 1 = Decriminalization; 2 = Medicalization; 3 = Legalization
Features:
- Voting: Whether or not the state voted Democrat (Barack Obama) in the 2008 election
- 0 = Not Majority Democrat; 1 = Majority Democrat
- Initiative: Whether or not the state has the "initiative" process instated
- 0 = No Initiative Process; 1 = Initiative Process
- # Marijuana Ballots: The number of marijuana-related ballot initiatives in the state (up to 2018)
Below, we see the accuracy for each of the algorithms.
| Name | Accuracy | Standard Deviation |
|---|---|---|
| Linear Discriminant Analysis | 0.641026 | 0.191880 |
| Logistic Regression | 0.564103 | 0.158062 |
| Support Vector Machines | 0.641026 | 0.072524 |
| K Nearest Neighbors | 0.769231 | 0.062807 |
| Decision Tree | 0.641026 | 0.191880 |
We see here that K Nearest Neighbors is the best algorithm for predicting the label from the features. Given this information, we can predict whether a state, given certain features, is expected to legalize.
For a hypothetical state that voted for Barack Obama in 2008, allows the initiative process, and has had marijuana on the ballot five times, their features are as follows:
- Voting: 1 = Majority Democrat
- Initiative: 1 = Initiative Process
- # Marijuana Ballots: 5 Ballot Initiatives
- Status: 3 = Legalization